# numeric 数值型,str()查看对象的类型
a1 <- c(1,2,3,4,5)
str(a1)
num [1:5] 1 2 3 4 5str(pi) num 3.14str(sqrt(2)) num 1.41# numeric 数值型,str()查看对象的类型
a1 <- c(1,2,3,4,5)
str(a1) num [1:5] 1 2 3 4 5str(pi) num 3.14str(sqrt(2)) num 1.41# integer 整数型
a2 <- 5L #L 表示该值是整数
str(a2) int 5# 1:5生成序列1,2,3,4,5
a3 <- 1:5
str(a3) int [1:5] 1 2 3 4 5a4 <- as.numeric(a3)
str(a4) num [1:5] 1 2 3 4 5answer <- c(TRUE,TRUE,TRUE,FALSE,TRUE,FALSE)
#查看answer的类型
str(answer) logi [1:6] TRUE TRUE TRUE FALSE TRUE FALSE#逻辑型向量求和,TRUE = 1, FALSE = 0
sum(answer) [1] 4#逻辑型向量求平均,TRUE的比例
mean(answer) [1] 0.6666667#!逻辑值取反
!answer[1] FALSE FALSE FALSE TRUE FALSE TRUE# data.frame()创建数据框
df <- data.frame(
id = 1:50,
age = round(rnorm(50,40,5)),
edu = c(rep("highschool",20),
rep("bachelor", 15),
rep("master",15)),
sex = ifelse(rbinom(50, 1, 0.6) == 1,
"male", "female")
)
head(df) #显示df的前六行 id age edu sex
1 1 26 highschool male
2 2 39 highschool female
3 3 41 highschool female
4 4 48 highschool female
5 5 43 highschool female
6 6 41 highschool femaledf$edu #edu是字符串,有双引号 [1] "highschool" "highschool" "highschool" "highschool" "highschool"
[6] "highschool" "highschool" "highschool" "highschool" "highschool"
[11] "highschool" "highschool" "highschool" "highschool" "highschool"
[16] "highschool" "highschool" "highschool" "highschool" "highschool"
[21] "bachelor" "bachelor" "bachelor" "bachelor" "bachelor"
[26] "bachelor" "bachelor" "bachelor" "bachelor" "bachelor"
[31] "bachelor" "bachelor" "bachelor" "bachelor" "bachelor"
[36] "master" "master" "master" "master" "master"
[41] "master" "master" "master" "master" "master"
[46] "master" "master" "master" "master" "master" #factor()将字符串转换为因子,默认level按字母顺序
df$edu <- factor(df$edu)
#查看因子df$edu的level顺序
levels(df$edu) [1] "bachelor" "highschool" "master" #edu是因子,没有双引号
df$edu [1] highschool highschool highschool highschool highschool highschool
[7] highschool highschool highschool highschool highschool highschool
[13] highschool highschool highschool highschool highschool highschool
[19] highschool highschool bachelor bachelor bachelor bachelor
[25] bachelor bachelor bachelor bachelor bachelor bachelor
[31] bachelor bachelor bachelor bachelor bachelor master
[37] master master master master master master
[43] master master master master master master
[49] master master
Levels: bachelor highschool master#箱线图的排列按edu的三个组别的字母顺序
boxplot(df$age ~ df$edu) 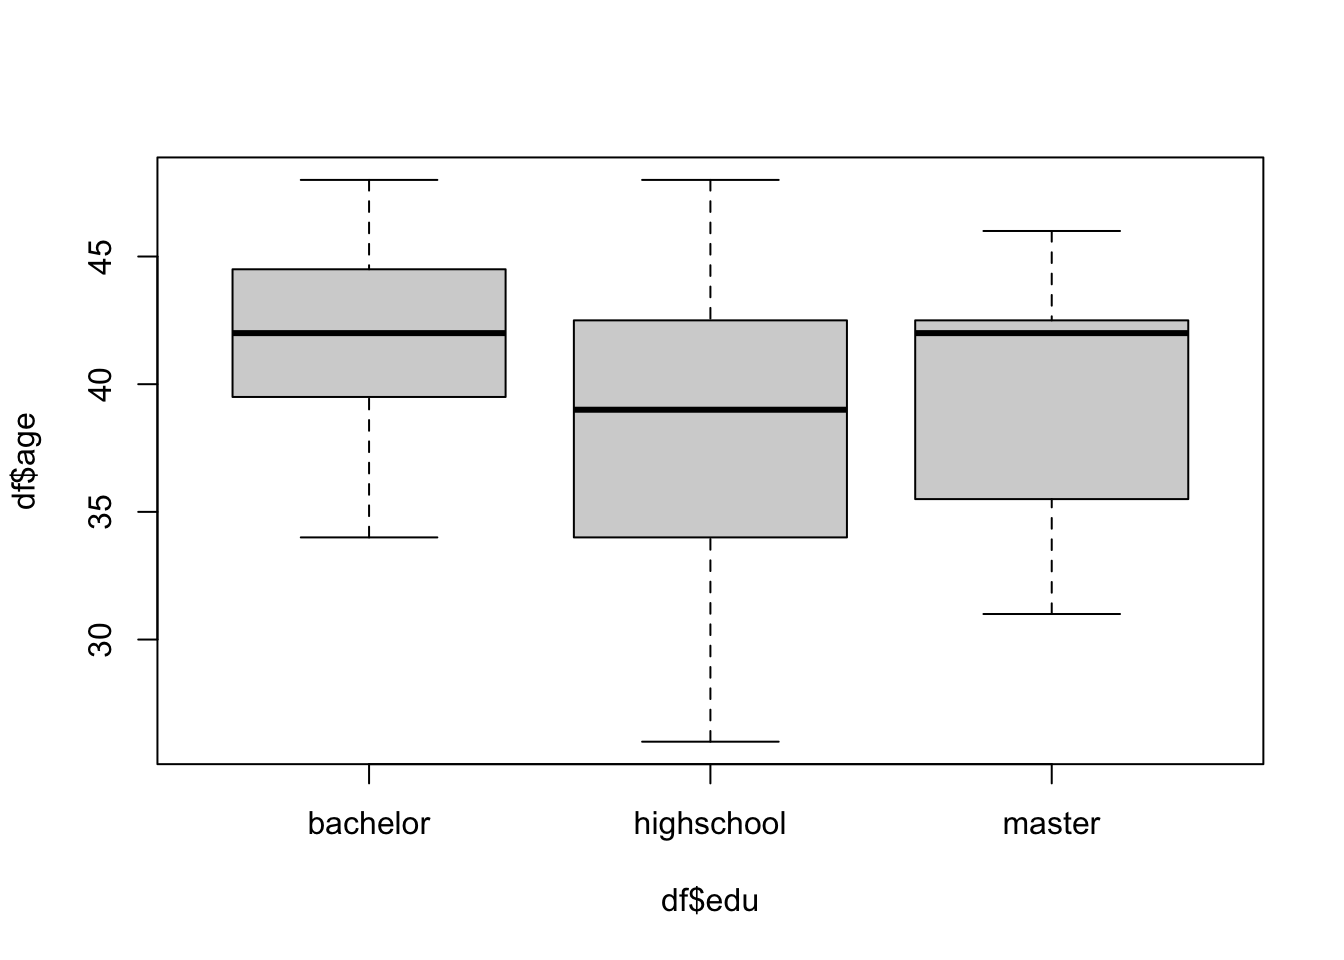
# ordinal scale, levels = 自定义逻辑顺序
df$edu <- factor(df$edu,
                 levels = c("highschool", "bachelor", "master"))
levels(df$edu)
[1] "highschool" "bachelor" "master" boxplot(df$age ~ df$edu)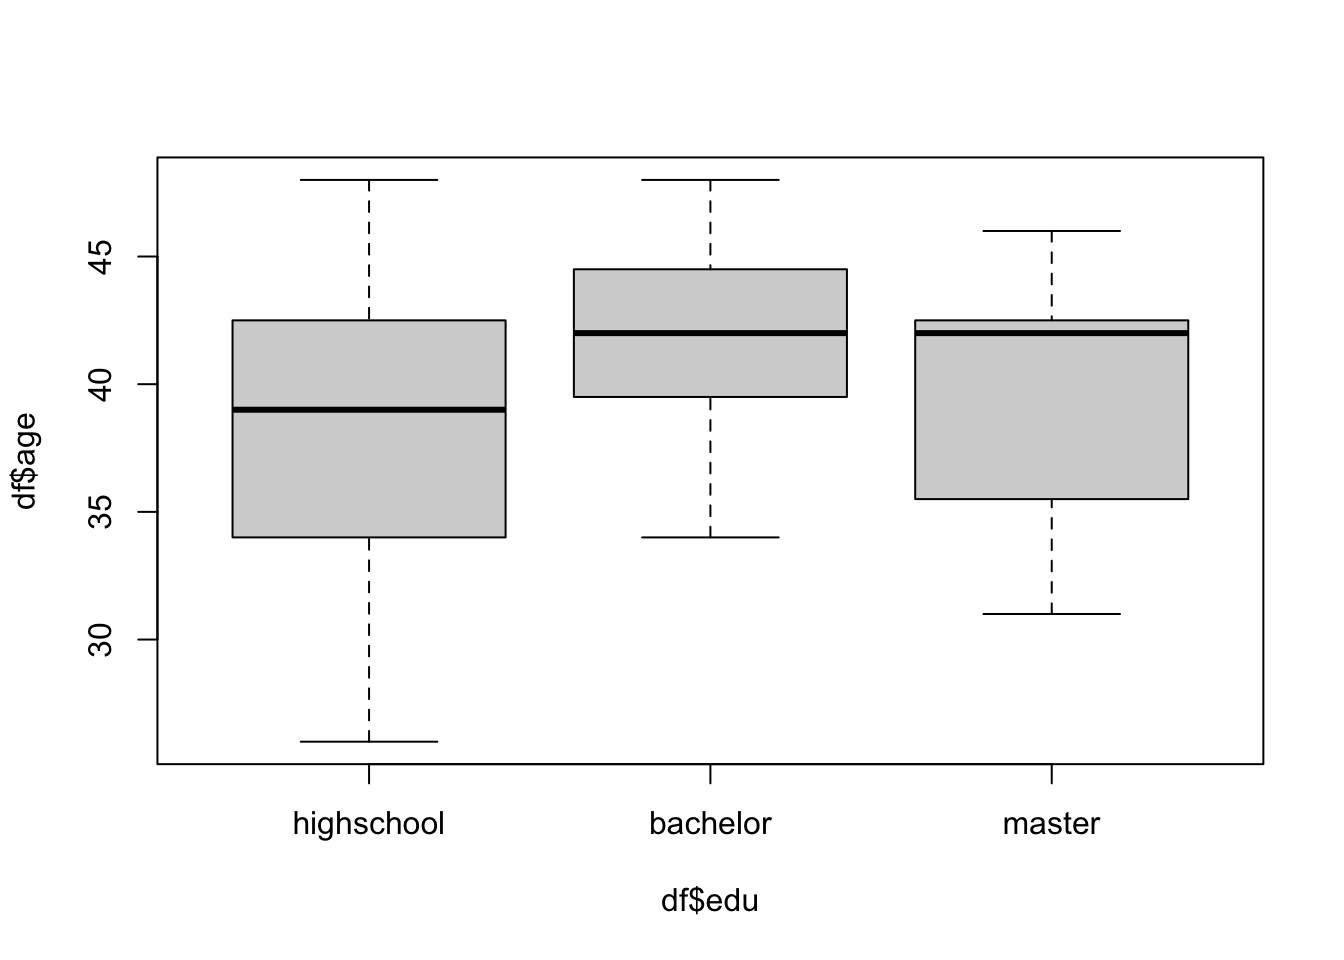
#将数值型数据转换为因子
df$age_group <- cut(df$age, 4)

#查看因子的水平个数
nlevels(df$age_group)
[1] 4#呈现age_group和edu的列联表
table(df$age_group, df$edu)
            highschool bachelor master
  (26,31.5]          4        0      2
  (31.5,37]          4        3      3
  (37,42.5]          7        7      6
(42.5,48] 5 5 4# 向量
# scalar
age <- 5
name <- "Harry"
# numeric vector
a <- c(1,2,3,4,5) # c() Combine Values into a Vector
a[1:3] #提取向量中的元素[ ][1] 1 2 3a[a > 3] #提取大于3的元素[1] 4 5a > 3 # 返回逻辑值[1] FALSE FALSE FALSE TRUE TRUE# character vector
b <- LETTERS[1:10]
b[5][1] "E"b[c(2,4,6)][1] "B" "D" "F"b[1:3][1] "A" "B" "C"#logical vector
answer <- c(TRUE,TRUE,TRUE,FALSE,TRUE,FALSE) # matrix()创建矩阵, 默认按列的方向填充
y1<-matrix(1:20, nrow=5, ncol=4)
y1[3, ] #第3行[1] 3 8 13 18y1[, 1] #第2列[1] 1 2 3 4 5y1[1:3, 2:4] #第1-3行的第2-4列 [,1] [,2] [,3]
[1,] 6 11 16
[2,] 7 12 17
[3,] 8 13 18# byrow = TRUE 按行方向填充
y2<-matrix(1:20, nrow=5, ncol=4, byrow = TRUE)
y2[3,2] #第3行第2列[1] 10# 矩阵中可以存放字符串
cells <- letters[1:10]
# 定义矩阵的行名、列名
rnames <- c("team1", "team2")
cnames <- c("class1", "class2", "class3", "class4", "class5")
mymatrix <- matrix(cells, nrow=2, ncol=5, byrow=TRUE,
dimnames=list(rnames, cnames))
mymatrix["team1", ]class1 class2 class3 class4 class5
"a" "b" "c" "d" "e" mymatrix[, "class1"]team1 team2
"a" "f" #创建数据框data.frame()
d <- c(1,2,3,4)
e <- c("red", "white", "green", NA)
f <- c(TRUE,TRUE,TRUE,FALSE)
df <- data.frame(id = d,
color = e,
pass = f)
df id color pass
1 1 red TRUE
2 2 white TRUE
3 3 green TRUE
4 4 <NA> FALSEdf[1:2] #第1-2列 id color
1 1 red
2 2 white
3 3 green
4 4 <NA>df[c("id","pass")] #df中的向量id和pass id pass
1 1 TRUE
2 2 TRUE
3 3 TRUE
4 4 FALSEdf$color[1] "red" "white" "green" NA View(mtcars) #以表单形式浏览数据框
head(mtcars) #浏览数据框的前六行 mpg cyl disp hp drat wt qsec vs am gear carb
Mazda RX4 21.0 6 160 110 3.90 2.620 16.46 0 1 4 4
Mazda RX4 Wag 21.0 6 160 110 3.90 2.875 17.02 0 1 4 4
Datsun 710 22.8 4 108 93 3.85 2.320 18.61 1 1 4 1
Hornet 4 Drive 21.4 6 258 110 3.08 3.215 19.44 1 0 3 1
Hornet Sportabout 18.7 8 360 175 3.15 3.440 17.02 0 0 3 2
Valiant 18.1 6 225 105 2.76 3.460 20.22 1 0 3 1tail(mtcars) #浏览数据框的后六行 mpg cyl disp hp drat wt qsec vs am gear carb
Porsche 914-2 26.0 4 120.3 91 4.43 2.140 16.7 0 1 5 2
Lotus Europa 30.4 4 95.1 113 3.77 1.513 16.9 1 1 5 2
Ford Pantera L 15.8 8 351.0 264 4.22 3.170 14.5 0 1 5 4
Ferrari Dino 19.7 6 145.0 175 3.62 2.770 15.5 0 1 5 6
Maserati Bora 15.0 8 301.0 335 3.54 3.570 14.6 0 1 5 8
Volvo 142E 21.4 4 121.0 109 4.11 2.780 18.6 1 1 4 2dim(mtcars) #查看数据框的行数和列数[1] 32 11str(mtcars) #查看数据框的结构'data.frame': 32 obs. of 11 variables:
$ mpg : num 21 21 22.8 21.4 18.7 18.1 14.3 24.4 22.8 19.2 ...
$ cyl : num 6 6 4 6 8 6 8 4 4 6 ...
$ disp: num 160 160 108 258 360 ...
$ hp : num 110 110 93 110 175 105 245 62 95 123 ...
$ drat: num 3.9 3.9 3.85 3.08 3.15 2.76 3.21 3.69 3.92 3.92 ...
$ wt : num 2.62 2.88 2.32 3.21 3.44 ...
$ qsec: num 16.5 17 18.6 19.4 17 ...
$ vs : num 0 0 1 1 0 1 0 1 1 1 ...
$ am : num 1 1 1 0 0 0 0 0 0 0 ...
$ gear: num 4 4 4 3 3 3 3 4 4 4 ...
$ carb: num 4 4 1 1 2 1 4 2 2 4 ...# 创建列表list
mylist <- list(myvector = y1,
mymatrix = cells,
mydata = df)
mylist[[1]][2,3] #第1个对象中的第2行第3列[1] 12mylist[[3]][, 2] #第3个对象中的第2列[1] "red" "white" "green" NA #hist()函数的运行结果被保存为list
x <- runif(100)
p <- hist(x)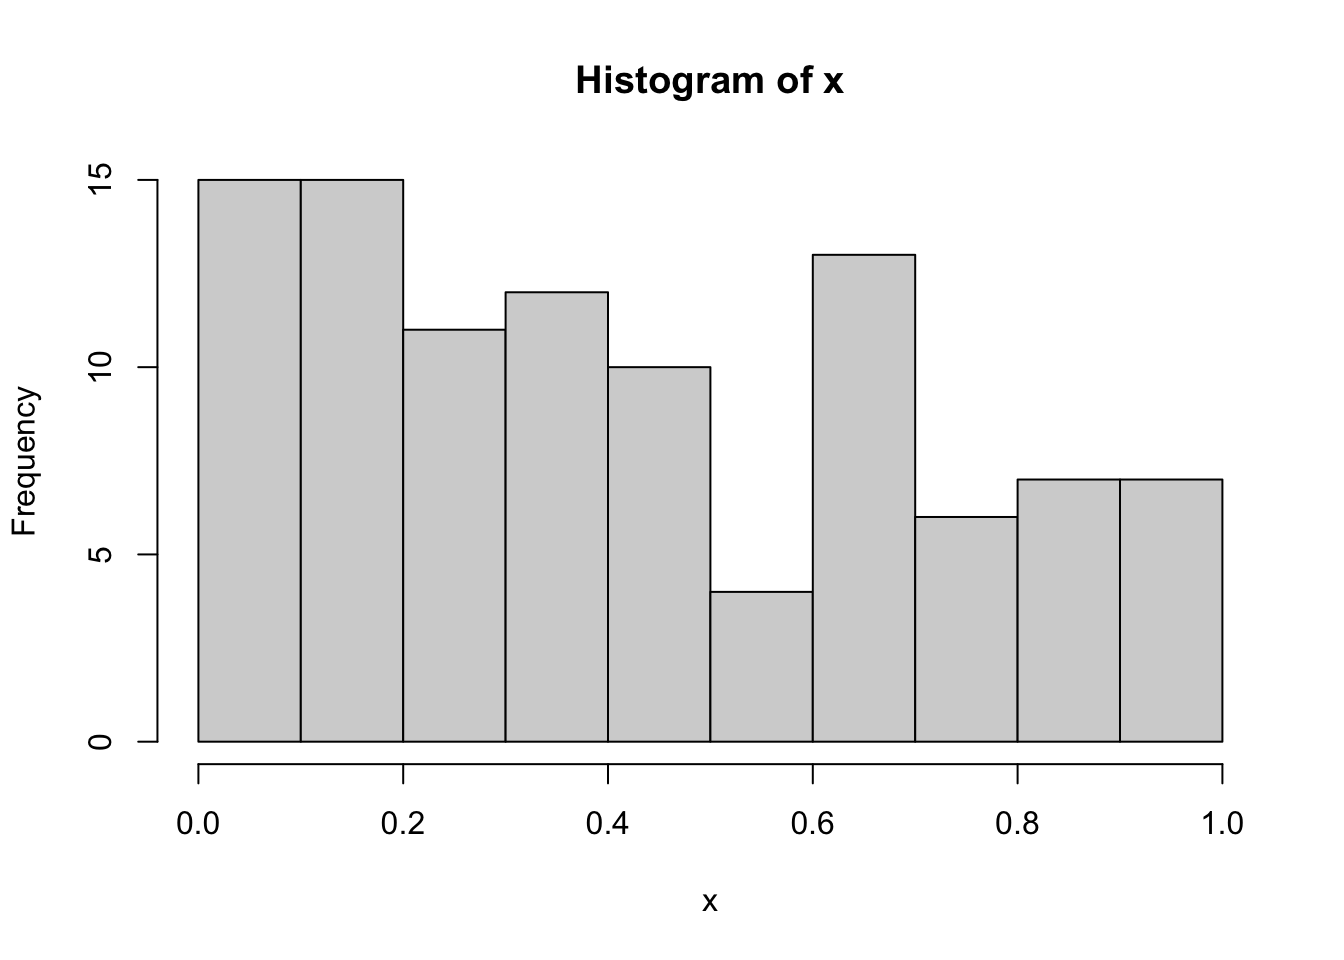
p$breaks
[1] 0.0 0.1 0.2 0.3 0.4 0.5 0.6 0.7 0.8 0.9 1.0
$counts
[1] 15 15 11 12 10 4 13 6 7 7
$density
[1] 1.5 1.5 1.1 1.2 1.0 0.4 1.3 0.6 0.7 0.7
$mids
[1] 0.05 0.15 0.25 0.35 0.45 0.55 0.65 0.75 0.85 0.95
$xname
[1] "x"
$equidist
[1] TRUE
attr(,"class")
[1] "histogram"